GDU Intro
Something went wrong. Please try again later...
By Dairyland Seed Agronomy Team
By Dairyland Seed Agronomy Team
Growing degree units (GDUs), also called growing degree days (GDD) and heat units (HU), are the calculated accumulation of heat on a daily basis. Plant and insect development are dependent on temperature to move through growth stages. Tracking GDUs allows us to predict things like plant emergence, maturity or insect pressure. For example, corn emergence occurs around 100-120 GDUs while soybean emergence happens around 130 GDUs. The warmer the temperature (to a max of 86°F for corn and soybeans) the faster the development. Warm-season crops like corn and soybeans will not have significant growth at temperatures less than 50°F so a base of 50 is used for the GDU calculations. Below are some examples of useful tools that allow you to do more than just track or calculate GDUs.
Midwestern Regional Climate Center can be found at https://mrcc.purdue.edu/modified-growing-degree-days. This tool shows Modified Growing Degree Days which are GDUs for a selected period with a base temperature of 50°F and a ceiling of 86°F. Different dates and ranges can be selected to show GDU accumulation and the departure from normal GDU accumulation. Several other tools can be found on this site, including a weed emergence tool, drought monitoring tool and crop progress reports.
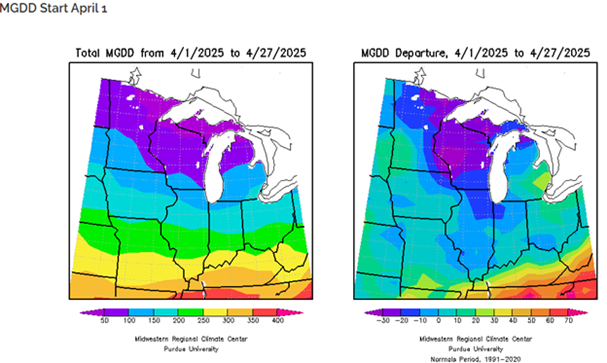
Figure 1. Modified Growing Degree Days and departure from normal.
The Useful to Usable (U2U) tool is a multi-state tool that uses current and historical climate data to help predict when your corn will reach certain growth stages including physiological maturity. This tool can be found at https://mrcc.purdue.edu/tools/corngdd. Start by entering your location then enter the planting date of interest. Next you can manually enter the GDUs to silking and to maturity which can be found on the product tech sheets. You can also just select a relative maturity which will populate a standard GDUs for silking and black layer. Figure 2 shows an example of DS-4510Q planted on April 25th in Lansing, MI. The gray shaded region shows the highest and lowest expected GDU accumulation for the rest of the season. Anticipated silking date is represented by the red vertical line and the black vertical line represents the expected black layer date. The dashed black line indicates the first likely black layer date. The tall dark blue bar represents the probability of the first 28-degree night.
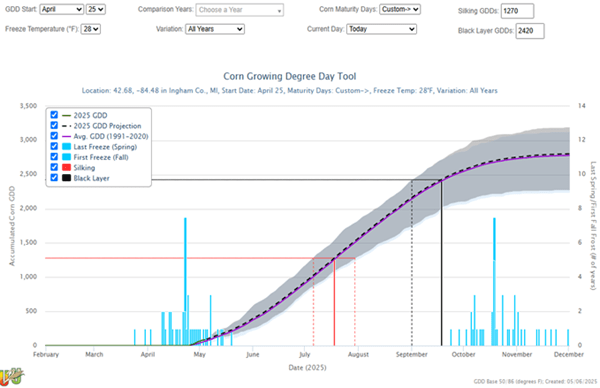
Figure 2. U2U example using DS-4510Q.
Remember this is just a projection of the most likely scenario but it still gives you a very useful guide for your area. Several tools exist at a more local level so be sure to check with universities for more options to monitor pest pressure and other crop stressors.
If you have any questions feel free to reach out to your local DSM or agronomist.
 Brian Weller |
 Dan Ritter |
 Chad Staudinger |
 Mark Gibson |
 Amanda Goffnett |
 Ryan Mueller |